Figure 8
A relevant article, white papers and other documents concerning the mRNA vaccine: an interesting collection useful to better understand some phenomena and to generate hypotesys
Luisetto M*, Naseer Almukthar, Edbey K, Tarro G, Nili B Ahmadabadi, Cabianca L, Mashori Gulam Rasool, Gadama G Prince and Oleg Yurevich Latyshev
Published: 13 October, 2022 | Volume 6 - Issue 1 | Pages: 053-067
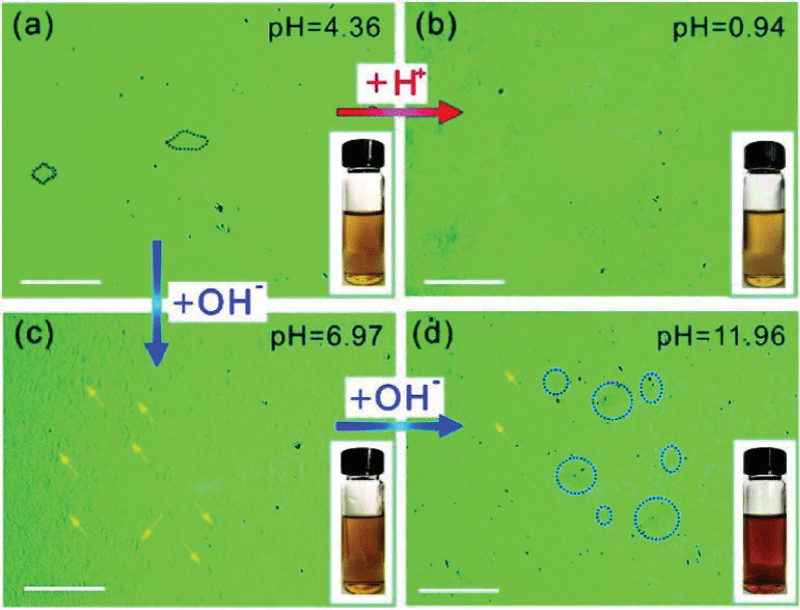
Figure 8:
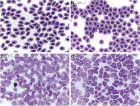
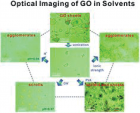
Figure 8: (a–d) OM images of GO graphene oxide suspensions of 0.1 mg mL−1 at different pH values. The red dashed lines in (a) mark GO sheets in the stretched state, the yellow- arrows in (c) and (d) mark GO scrolls, and the blue dashed circles in (d) mark crumbled or agglomerated GO. Insets: photographs of the GO suspensions in water at different pH values. Scale bars are 100 μm.
Read Full Article HTML DOI: 10.29328/journal.jfsr.1001037 Cite this Article Read Full Article PDF
More Images
Similar Articles
-
Correlate alcohol and toxicology analysis with Urinary Bladder Distension on Post-mortem Computed Tomography (PMCT): A Validation StudyLai Poh Soon*,Mohamad Helmee Mohamad Noor,Nor Fadhilah Madon,Mohd Hilmi Saidin,Mansharan Kaur Chainche,Singh,Kunasilan Subramaniam. Correlate alcohol and toxicology analysis with Urinary Bladder Distension on Post-mortem Computed Tomography (PMCT): A Validation Study. . 2018 doi: 10.29328/journal.jfsr.1001014; 2: 009-015
-
A case of Pulmonary Tuberculosis complicated by Pulmonary ThromboembolismWang Jie*,Jiawen Wang,Changwu Wan,Yuanhe Wang,Mingjie Li,Le Chen. A case of Pulmonary Tuberculosis complicated by Pulmonary Thromboembolism. . 2020 doi: 10.29328/journal.jfsr.1001018; 4: 004-006
-
Victim of violent death: what is the role of alcoholemia?Ivan Dieb Miziara*,Carmen Silvia Molleis Galego Miziara. Victim of violent death: what is the role of alcoholemia?. . 2021 doi: 10.29328/journal.jfsr.1001027; 5: 048-052
-
A relevant article, white papers and other documents concerning the mRNA vaccine: an interesting collection useful to better understand some phenomena and to generate hypotesysLuisetto M*,Naseer Almukthar,Edbey K,Tarro G,Nili B Ahmadabadi,Cabianca L,Mashori Gulam Rasool,Gadama G Prince,Oleg Yurevich Latyshev. A relevant article, white papers and other documents concerning the mRNA vaccine: an interesting collection useful to better understand some phenomena and to generate hypotesys. . 2022 doi: 10.29328/journal.jfsr.1001037; 6: 053-067
-
Alcohol drinking and driving habit particularly in Nigeria and the role forensic science could playMaurice E Nwakobi*. Alcohol drinking and driving habit particularly in Nigeria and the role forensic science could play. . 2022 doi: 10.29328/journal.jfsr.1001038; 6: 068-076
-
Biotechnology in Forensic Science: Advancements and ApplicationsSunny Antil,Vandana Joon*. Biotechnology in Forensic Science: Advancements and Applications. . 2025 doi: 10.29328/journal.jfsr.1001073; 9: 007-014
Recently Viewed
-
Success, Survival and Prognostic Factors in Implant Prosthesis: Experimental StudyEpifania Ettore*, Pietrantonio Maria, Christian Nunziata, Ausiello Pietro. Success, Survival and Prognostic Factors in Implant Prosthesis: Experimental Study. J Oral Health Craniofac Sci. 2023: doi: 10.29328/journal.johcs.1001045; 8: 024-028
-
Agriculture High-Quality Development and NutritionZhongsheng Guo*. Agriculture High-Quality Development and Nutrition. Arch Food Nutr Sci. 2024: doi: 10.29328/journal.afns.1001060; 8: 038-040
-
A Low-cost High-throughput Targeted Sequencing for the Accurate Detection of Respiratory Tract PathogenChangyan Ju, Chengbosen Zhou, Zhezhi Deng, Jingwei Gao, Weizhao Jiang, Hanbing Zeng, Haiwei Huang, Yongxiang Duan, David X Deng*. A Low-cost High-throughput Targeted Sequencing for the Accurate Detection of Respiratory Tract Pathogen. Int J Clin Virol. 2024: doi: 10.29328/journal.ijcv.1001056; 8: 001-007
-
A Comparative Study of Metoprolol and Amlodipine on Mortality, Disability and Complication in Acute StrokeJayantee Kalita*,Dhiraj Kumar,Nagendra B Gutti,Sandeep K Gupta,Anadi Mishra,Vivek Singh. A Comparative Study of Metoprolol and Amlodipine on Mortality, Disability and Complication in Acute Stroke. J Neurosci Neurol Disord. 2025: doi: 10.29328/journal.jnnd.1001108; 9: 039-045
-
Development of qualitative GC MS method for simultaneous identification of PM-CCM a modified illicit drugs preparation and its modern-day application in drug-facilitated crimesBhagat Singh*,Satish R Nailkar,Chetansen A Bhadkambekar,Suneel Prajapati,Sukhminder Kaur. Development of qualitative GC MS method for simultaneous identification of PM-CCM a modified illicit drugs preparation and its modern-day application in drug-facilitated crimes. J Forensic Sci Res. 2023: doi: 10.29328/journal.jfsr.1001043; 7: 004-010
Most Viewed
-
Evaluation of Biostimulants Based on Recovered Protein Hydrolysates from Animal By-products as Plant Growth EnhancersH Pérez-Aguilar*, M Lacruz-Asaro, F Arán-Ais. Evaluation of Biostimulants Based on Recovered Protein Hydrolysates from Animal By-products as Plant Growth Enhancers. J Plant Sci Phytopathol. 2023 doi: 10.29328/journal.jpsp.1001104; 7: 042-047
-
Sinonasal Myxoma Extending into the Orbit in a 4-Year Old: A Case PresentationJulian A Purrinos*, Ramzi Younis. Sinonasal Myxoma Extending into the Orbit in a 4-Year Old: A Case Presentation. Arch Case Rep. 2024 doi: 10.29328/journal.acr.1001099; 8: 075-077
-
Feasibility study of magnetic sensing for detecting single-neuron action potentialsDenis Tonini,Kai Wu,Renata Saha,Jian-Ping Wang*. Feasibility study of magnetic sensing for detecting single-neuron action potentials. Ann Biomed Sci Eng. 2022 doi: 10.29328/journal.abse.1001018; 6: 019-029
-
Pediatric Dysgerminoma: Unveiling a Rare Ovarian TumorFaten Limaiem*, Khalil Saffar, Ahmed Halouani. Pediatric Dysgerminoma: Unveiling a Rare Ovarian Tumor. Arch Case Rep. 2024 doi: 10.29328/journal.acr.1001087; 8: 010-013
-
Physical activity can change the physiological and psychological circumstances during COVID-19 pandemic: A narrative reviewKhashayar Maroufi*. Physical activity can change the physiological and psychological circumstances during COVID-19 pandemic: A narrative review. J Sports Med Ther. 2021 doi: 10.29328/journal.jsmt.1001051; 6: 001-007

HSPI: We're glad you're here. Please click "create a new Query" if you are a new visitor to our website and need further information from us.
If you are already a member of our network and need to keep track of any developments regarding a question you have already submitted, click "take me to my Query."


